

On my latest articles — see ‘Do we need a protocol for data center energy?‘ an ‘Grip on numbers; Figures highlighted; Figures…’ — I received a response from various organizations and people. Thanks for that. In general, everyone agreed on the gist of the message: there must be more transparency and insight into the energy consumption of data centers. Everyone also agrees that the solution must be sought in collaboration between all stakeholders. However, there were also some points of criticism. These were mainly focused on the formulas used and the use of data. And that’s exactly what it’s about for me.
I actually write these articles because I really try to understand the data. And I have to admit, it’s not easy. So much data is thrown into the world and also taken over indiscriminately, that I have the feeling of being present in a virtual world. The reality may well be different.
Definition issues
The illustrations in Figure 1 are from the latest DDA report published on June 9. This report — entitled ‘State of the Dutch Data Centers 2020’ — can be requested via the DDA site. According to this report, 17.95 PJ is an energy consumption of 570 MW: 570 x 8,760 hours = 4,993,200 MWh = 17.95 PJ.
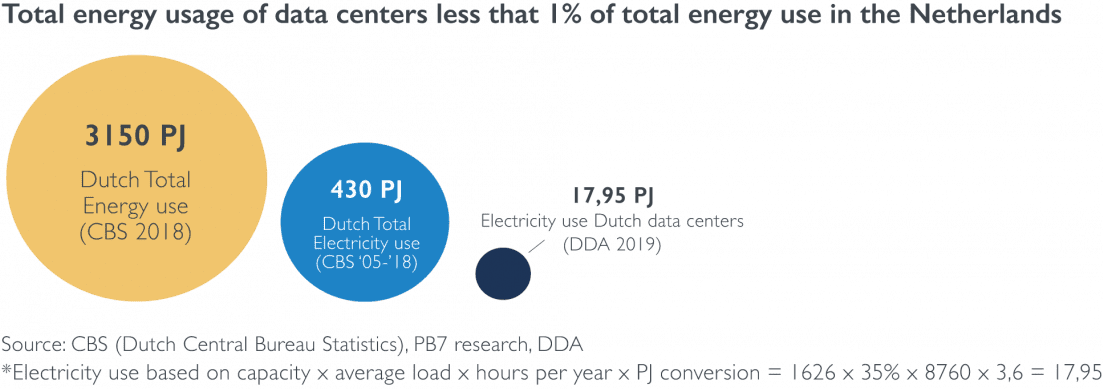
What first strikes me in figure 1 are the terms (definitions) ‘electricity use’ and the term ‘electricity use based on capacity’. Apparently you can calculate the consumption of energy if you know the contractual energy contracts. In other words, these are the energy contracts that data centers enter into with the energy suppliers.
In the webinar of the DDA following the publication of the report, an explanation was also given why this ‘electricity use based on capacity’ is so much higher than the ‘electricity use’. That’s because of the peak power.
The 35 percent question
After this comment, my imagination ran away with me a bit: what is meant by ‘peak power’? And where does that 35% in the DDA calculation come from? How can I interpret this?
Does the DDA mean:
- On the energy network is now a bandwidth of 65% upwards for the energy variation in the data center?
- Does the energy consumption in the data center fluctuate, with a safety margin of almost 200%?
- What do they mean by “peak power”? Are backups suddenly made?
My experience is that the energy consumption has a variation over the whole day of at most 5%. That is a bandwidth of +5% and ‑5% of the median. But no peaks of 50% or more. How are these peaks absorbed by the cooling and UPS? Can these handle that variation?
The 35% in the formula raises a number of questions for me. Is it meant that:
- 35% of the total energy (power) contracts are actually consumed in terms of energy in the data center?
- 35% of a server’s energy is used, the rest of the time is the machine idle?
- 35% of the data center surface is occupied?
- 35% of the number of racks is filled?
- 35% of the total contract capital; don’t we have overcapacity?
- 35%, is there actually a shortage of energy in the Amsterdam region?
- Or maybe something completely different?
Neutrality
The big IT companies like to talk in detail about climate protection. They set goals for themselves and publish extensive environmental reports every year. They quantify their CO2 footprint in the reports. They use their statements and underlying data to support their claim that they are CO2-neutral (or ‘carbon neutral’). The really big ICT companies have been promoting this or have been advertising about this since 2007.
This neutrality is achieved by purchasing green certificates. However, these certificates only prove that electricity has been introduced somewhere in the network by, for example, solar energy. They thereby shift the share of existing renewable energy to specific consumers who pay for it.
However, what data is this detailed information based on and can we verify it? After all, energy consumption is linked to all kinds of targets, ranging from European to national targets. Or objectives that are linked to a region and in some cases even to a subsidy.
In order to be able to monitor targets, we should be able to fall back on consulting a database in the Netherlands — and also in Europe — in which we can compare apples with apples. I have the feeling that we are now at the mercy of what I call ‘the issues of the day’. In other words, everyone uses the numbers as they see fit at the time.
Questions and answers
In various media and on internet forums you see questions with bizarre answers. These are often derived from existing information and as a result you get nonsensical answers.
Questions are for example:
- In terms of CO2 use, is IT more harmful to the climate than, for example, aviation?
- Does the use of online videos blow as much CO2 into the air as Spain?
- How much energy does a Google search require?
Interesting questions in themselves, but due to the lack of good data it is almost impossible to give a well-informed answer. The result: answers that make no sense.
Data centers have become such an important part of our economy and digital world. Compared to other branches, they are young, but matured very quickly. This maturity also brings responsibilities. As far as I’m concerned, collecting and monitoring the energy consumption of data centers and its users is a great step towards leaving puberty behind us and showing the responsibility that comes with this phase.
Transparency helps
How do we achieve this? In any case, by doing it together — together with the government, together with the data centers and together with the interest groups of data centers and ICT.
What is the solution then? I would like to see a covenant between these parties, which stipulates that monthly reports are made to the government. Server owners report the data and provide insight into the energy consumption and behavior of the servers. Relevant data has been present at the heart of IT equipment for many years. BIOS, ILO and other software keep track of this data. Data centers report their total energy consumption and the energy consumption consumed by servers on a monthly basis. On the basis of this information, the government can then make regulations, of course in consultation with the interest groups. Data centers and ICT users can also use this information for accountability to their stakeholders and to society.
In the meantime, a start is being made behind the scenes with all stakeholders to get a better grip on the figures, energy figures that is. Transparency helps. The beginning is here. Now pack on.
Marco Verzijl has been active in the data center world for over 15 years. From 2005 to 2012 at KyotoCooling in the development of the Kyoto wheel. In 2013 he founded WCooliT together with Mees Lodder. WCooliT provides products and services for the efficient data center, including in the field of physical separation, turnkey modular data centers and 24x7 monitoring.