

The DIC was introduced in the previous edition of CloudWorks and DatacenterWorks. The purpose of this measurement is to provide insight into how efficiently IT handles the ‘power’ in the data center.
While it is not clear at this time what the efficiency is, it is estimated that 60 to 80% of all energy to the data centers is consumed without real IT performance being delivered. In short, doing nothing in IT costs a lot of energy.
The DIC has been defined by Dirk Harryvan and the undersigned as:
The energy consumed at idle, divided by the total energy consumption of the IT hardware
Idle is the state of the CPU that it is ‘waiting’ for external work. In idle state, the CPU is active for example for the operating system and the like, but it does not perform any external work. Idle can be very short but also longer — from milliseconds to long periods.
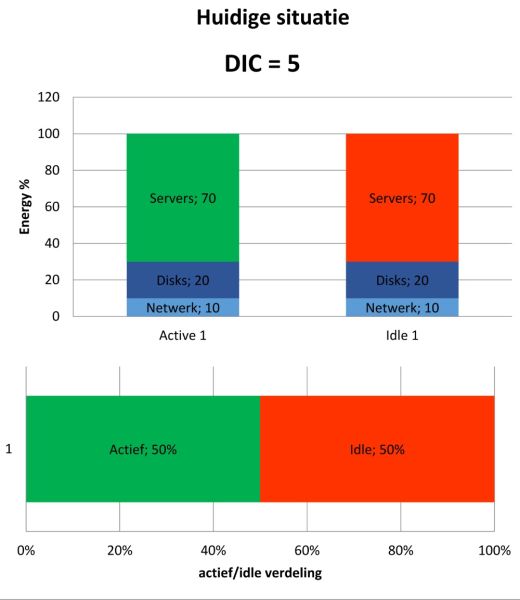
In figure 1 I explain the DIC calculation. We assume that the distribution of power is for IT: servers 70%, storage 20% and 10% for the network. If the servers are active, that is useful and therefore green. If the server is in idle state, then red. Red because nothing useful is running. Below that is the distribution between active and idle. In this example 50–50%. Again the equal color distribution. In this example, the IT hardware ‘uses’ in idle state just as much energy (70%) as in active state. The surface of power consumption and active/idle distribution is now: 50% of the power consumption is consumed in idle state and 50% in active state. The DIC is defined as a number always between 0 and 10. So here 50%/100%; that gives a DIC of 5.
So there are actually two variables that determine the DIC: energy consumption in idle state and the percentage of idle. Now let’s look at them separately to show the effects on the DIC through an example.
Savings Buttons
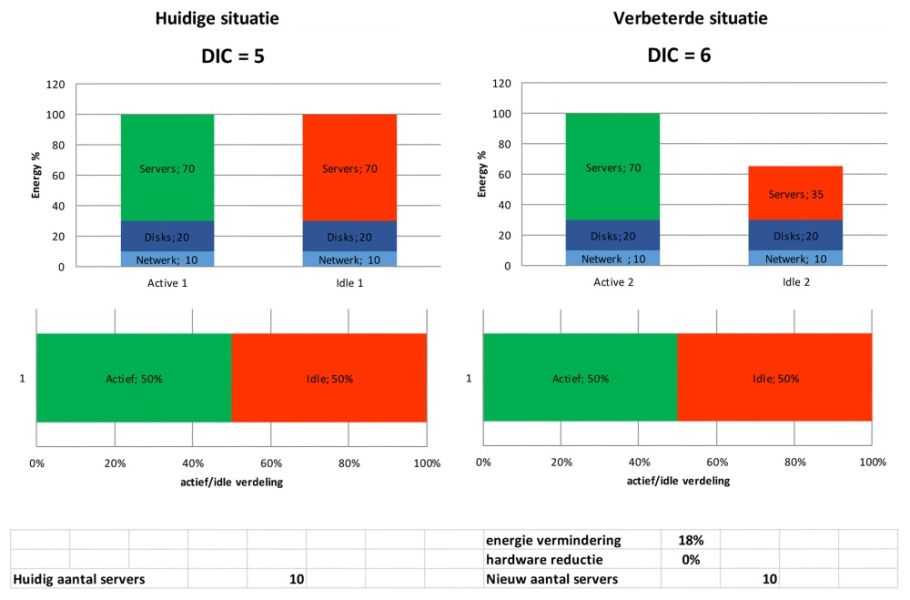
In the server hardware, Intel and associates have ‘baked in’ various possibilities to save energy when the server is in idle state. It is our experience that these possibilities are currently not used by practically anyone. Let’s assume that these ‘power buttons’ can save 25 to 50% when the server is idle.
In figure 2 we see the effect on the DIC. The DIC has been improved from 5 to 6 using the previous example as a base. It will also be clear that the idle power consumption will never reach zero. After all, the CPU is always active for the background tasks. It is, however, visible at the bottom that the energy saving is 18%. And that’s just because we use less energy in the idle state! 18% of the total IT load.
Reduce idle to 25%
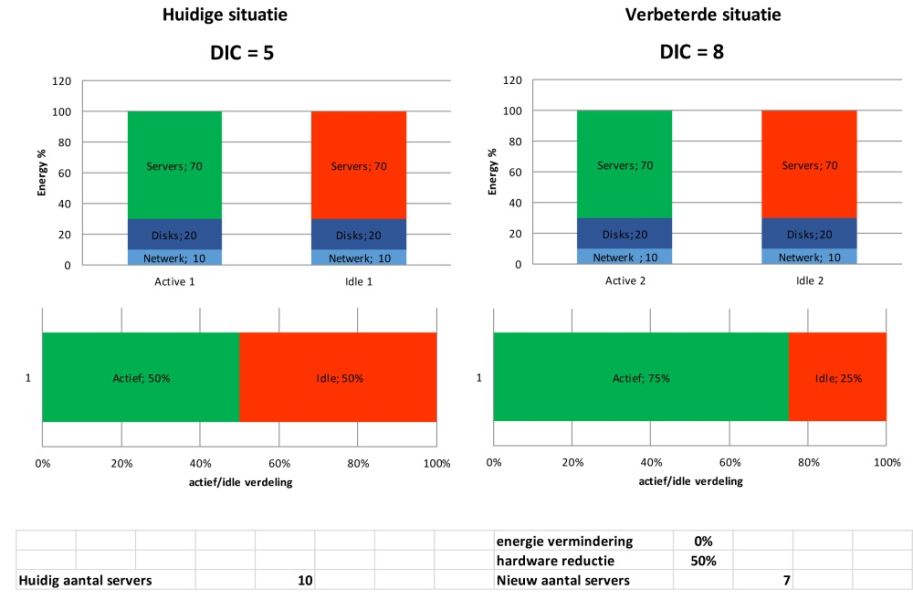
Now let’s lower the idle percentage from 50% to 25%. This means that the active state of the server has gone from 50% to 75%. A DIC from 5 to 8! So a huge improvement. However, in figure 3 it is stated: no energy savings. That’s true, but then again it’s not. The server(s) use the same amount of energy in active state and idle state. Nothing has changed in this example, so no savings are made. However, it is stated below that to process the IT activities, only 7 servers are now needed, compared to 10 before. So savings have been made. This is because 3 servers are needed less, which is a hardware saving. In addition, energy has also been saved, because only 7 servers are ‘on’ instead of 10. So in addition to the hardware savings, 30% has also been saved on the electricity bill.
What is the DIC now?
We expect that for most data centers the DIC will be 2 or less. This is due to the combination of no activation of the power saving options in idle state while the servers are a maximum of 20% active, so 80% idle or inactive — see figure 4.
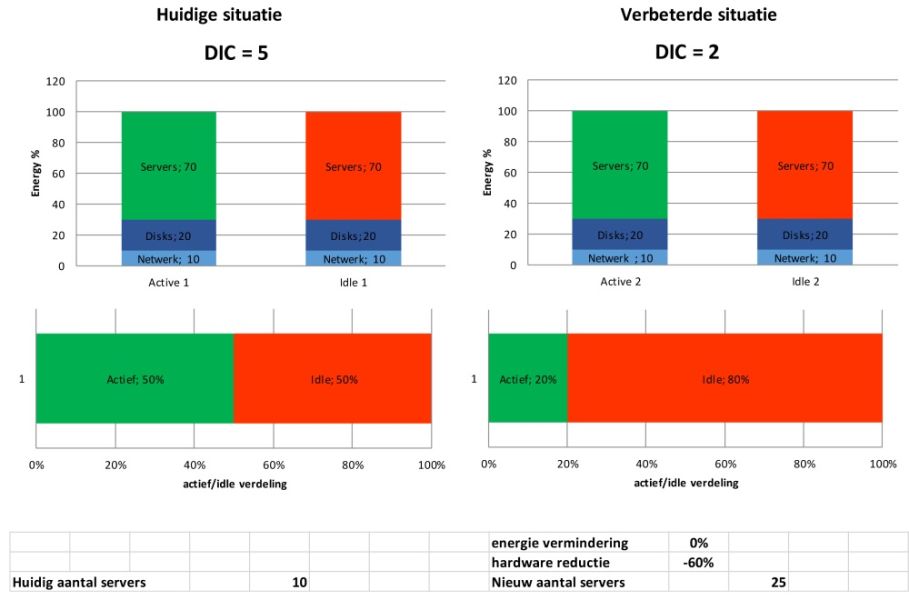
Mind you, a DIC of 2 actually says that 80% of the IT energy is used for NOTHING.
In the comparison you see that 25 servers are now needed.
Booster
The above is not an easy fare. It all doesn’t seem logical, it is also ‘counter intuitive’. However, it is the first attempt to ‘link’ power consumption of the IT systems to the real, measured power consumption in each data center. What it mainly shows is the enormous ‘waste’ of energy. The DIC has a role in raising awareness of energy consumption or waste in the data center. It is therefore primarily a driver of improvement, because of a better score than before.
A first start
Are we there now? No not at all. It’s really just a start. I just checked how many servers there are in the Netherlands. Between 300,000 and 500,000. Are we all going to determine the idle percentage of that? That’s quite a job. Noting and keeping track of current measurement per rack per month is also a challenge. That is probably more than 50,000 measurements.
And then also the UPS output current measurement. Those are just a few compared to racks and servers. However, if I have determined the highest maximum value, is that also the maximum? Is it possible that certain servers are in idle state? If they were active, wouldn’t the UPS load be higher? And that also applies to the minimum value. Who tells me that all servers are idle at that moment and not active?
Questions
Power measurement per rack also means that I have to average all the idle percentages of the servers in that rack. That leads at the very least to questions and in any case to a lower accuracy. Is it already known how the servers can be made much more active? Apparently not, otherwise we would have done it. Virtualization is actually a first step to go from less than 10% occupancy to as much as 20% active. What are the next steps? Do you already know them?
Role of government
And if you have read the previous article: why are the data centers and IT customers going to measure and improve the DIC again? I expect they won’t. Not because they don’t want to, but because they don’t have to and have other priorities. Energy costs are not a priority, so there is no real attention to it now and in the future. That only happens if the government intervenes. And who directs the government? That’s right, you and me. We will have to draw attention to it. For the enormous savings potential or as you wish: by paying attention to the enormous waste of energy in our IT. The glass is less than half full. So far, no one has really gotten ‘fat’ about this topic. That is why it will take some time before the data centers themselves start making DICs. Unless we manage to get the government moving.